

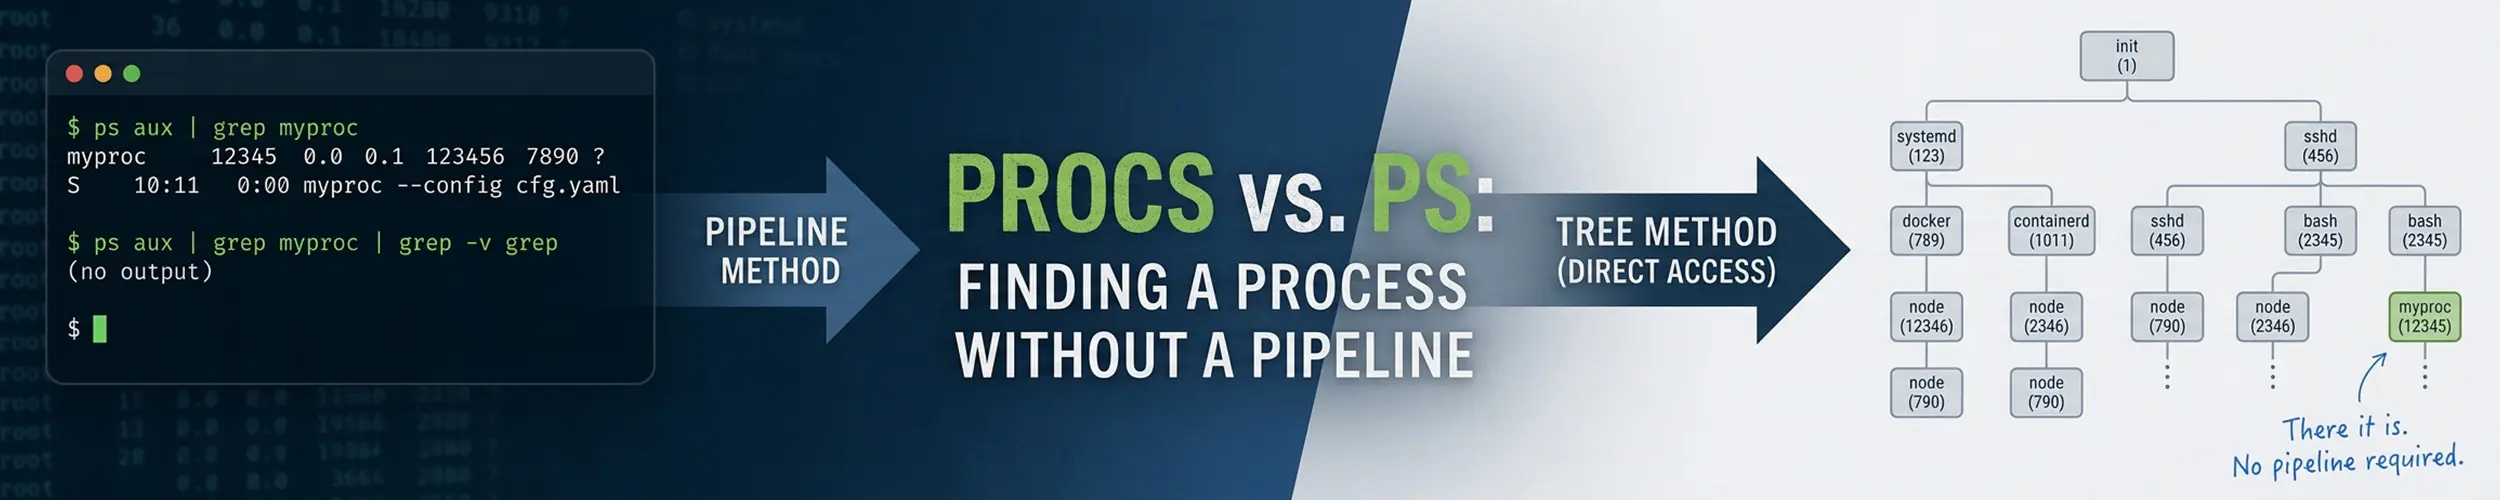
ps aux | grep nginx is one of the most-typed commands in existence, and it is a slightly embarrassing one: two commands, a pipeline, and a result that always includes the grep itself. procs replaces it with procs nginx, and adds the columns you would otherwise go looking for in three other tools.
The short verdict. A small, pleasant improvement rather than a revelation — install it on your own machine and enjoy the searching and the port column, but this is the least essential tool on this page. ps is on every system, its output format is stable enough to parse, and ps aux is a phrase every Linux person on earth understands. Never put procs in a script.
What it changes
ps | procs | |
|---|---|---|
| Finding one process | ps aux | grep name | procs name |
| Options | Two incompatible sets, BSD and UNIX | One, with long names |
| Listening ports | Not shown — use ss | A column |
| Container name | Not shown | A column, when Docker is running |
| Tree view | ps -ejH, or pstree | --tree |
| Live updates | No — use top | --watch |
| Colour | None | By state and by resource use |
| Output stability | Specified, scriptable | Not promised — do not parse it |
The ports column is the genuinely new thing. “Which process is listening on 8080” normally means ss -tlnp and then matching a PID by eye; here it is already beside the process.
Installing it
sudo apt install procs        # Debian, Ubuntu
sudo dnf install procs
sudo pacman -S procs
cargo install procs           # anywhere
procs --versionNo naming traps for once — the package and the command are both procs. One thing to know: the sockets belonging to other users are only visible to root, so without sudo the ports column is populated for your own processes and blank for everything else. That looks like a bug and is not.
Translating what you already do
| ps | procs |
|---|---|
ps aux | procs |
ps aux | grep nginx | procs nginx |
ps -p 1234 | procs 1234 |
ps -u alice | procs --or user:alice |
ps aux --sort=-%cpu | head | procs --sortd cpu |
ps aux --sort=-rss | head | procs --sortd mem |
ps -ejH / pstree | procs --tree |
watch 'ps aux | grep x' | procs --watch x |
ss -tlnp | grep 8080 | procs --or port:8080 |
A bare search term matches against the command, the name and the PID at once, which is why procs 1234 and procs nginx both do the obvious thing. For anything more precise, the keyword:value form filters on a specific column, and --and / --or combine several.
--tree is worth a mention of its own. Seeing that eleven processes are children of one supervisor — rather than eleven unrelated rows — is often the entire answer to “why are there so many of these”.
Where ps is still the right answer
- Every script.
ps -o pid=,comm=produces exactly the fields you asked for, in a documented format, on every Unix. procs makes no such promise and its columns change between versions. Parsing it is building on sand. - Servers and containers. Not installed, and the moment you need it is rarely the moment to be installing things.
- Selecting precise fields.
ps -eo pid,ppid,etimes,rss,args --sort=-rss— elapsed seconds, resident memory, whatever you want, in that order. procs is not built for this. - Anything about threads.
ps -eLfshows them; procs is process-oriented. - When you need
ps‘s exactness. TheSTATcolumn’s flags —Dfor uninterruptible sleep,Zfor a zombie,+for the foreground group — are precise, documented and diagnostic.
It is also worth being clear about what this tool is not. procs takes a snapshot, like ps. For watching a machine work — sorting live, killing from the interface, seeing load develop — you want htop or btop, and --watch is not a substitute for either.
Configuration
The default columns are reasonable but wide. If your terminal is not, a configuration file at ~/.config/procs/config.toml lets you choose which columns appear and in what order — dropping the ones you never read is the single change worth making.
procs --list                 # every available column
procs --insert TcpPort       # add one for this run
procs --pager disable # stop it opening a pager on short outputQuick reference
procs                      # everything
procs nginx                # search by name, command or PID
procs --tree               # parent and child structure
procs --sortd cpu          # busiest first
procs --sortd mem
procs --watch nginx        # refresh continuously
sudo procs --or port:8080  # what is listening there
procs --list # the available columnsRelated
- Processes — ps, top and htop, and the one that is always installed
- htop and btop vs top — for watching rather than snapshotting
- Processes and Memory — what the numbers in either tool actually mean
- Networking Basics —
ss, which is where the port column comes from