

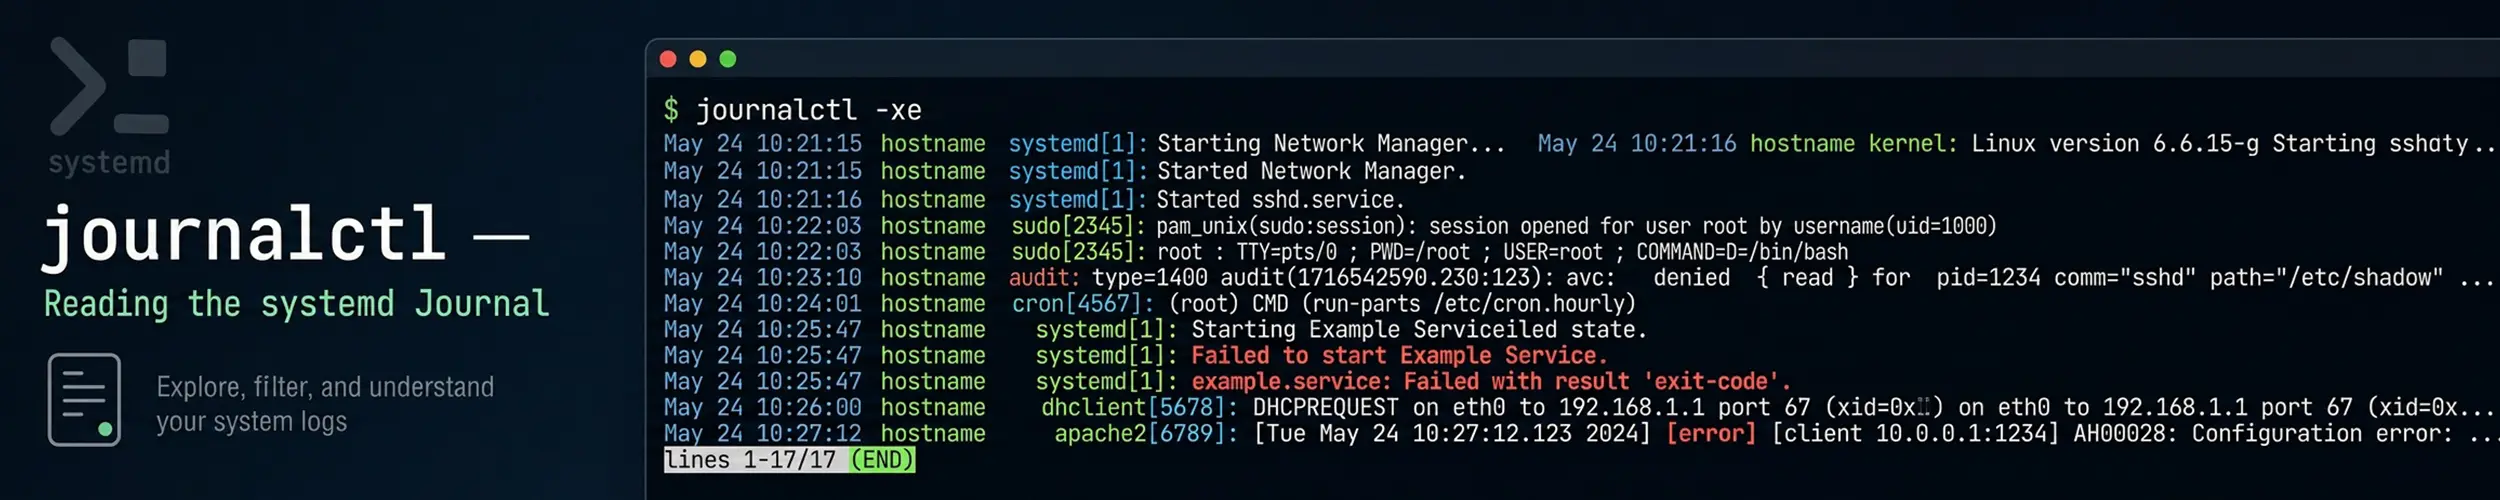
On any current Linux system, most logs are not in files. systemd collects them into a structured binary journal, which is why grep on /var/log increasingly finds nothing — and why journalctl can do things a text file cannot, like showing you only errors, only from one service, only since the last boot.
The four filters worth memorising
journalctl -u nginx              # one unit
journalctl -p err                # priority: errors and worse
journalctl -b                    # this boot only
journalctl --since "1 hour ago" # a time windowThey combine, and combining them is the whole skill. Nearly every real investigation is one line built from these four:
journalctl -u myapp -p err -b --no-pager
journalctl -u nginx --since "2026-08-30 09:00" --until "2026-08-30 10:00"
journalctl -p warning -b -1 # warnings from the boot that crashedSelecting what you want
| Option | What it does |
|---|---|
-u nginx.service | One unit — and, strictly, four fields at once: it also returns coredump records for the unit, anything PID 1 said about it, and anything any root daemon said about it. Repeat -u for several. |
-f | Follow, like tail -f. Combine with -u. |
-n 50 | The last fifty lines. |
-r | Newest first — useful when you only want the latest error. |
-k | Kernel messages only, the dmesg equivalent. |
-b, -b -1 | This boot; the previous boot. |
--list-boots | Which boots are still on disk, with dates. |
-p err | Priority: emerg alert crit err warning notice info debug. |
-g pattern | Match the message text with a regular expression. |
--user | Your own user units rather than the system ones. |
_PID=1234 | One process. Fields like this are matched directly. |
_COMM=sshd | The kernel’s short process name, from /proc/PID/comm and capped at fifteen characters — so it silently never matches a daemon with a longer name. _EXE= is the executable itself. |
/usr/sbin/sshd | A path argument matches _EXE, the path the kernel resolved. journald reads it from /proc after the fact, so it is absent — and the filter returns nothing — for anything that exits quickly. |
-p err means “error and everything more severe”, not “errors only” — the levels are a threshold. And a service that logs everything at info, as many do, will show nothing under -p err even while it is plainly failing; that is a property of the application, not of journalctl. There is a third way for it to come back empty on a broken machine: PRIORITY is an ordinary field supplied by whatever sent the entry, it is optional, and an entry that arrives without one matches no -p level at all except debug. An empty -p err is an absence of evidence rather than evidence of health.
Time syntax
journalctl --since today
journalctl --since yesterday --until today
journalctl --since "10 min ago"
journalctl --since "2026-08-30 09:15:00" --until "+30 min"
journalctl --since "-2h" -u myappIt accepts both absolute timestamps and relative English, which is more forgiving than almost anything else on the system. Timestamps are shown in local time by default; add --utc when comparing against logs from elsewhere, which is usually the right thing to do when correlating across machines.
Output formats
journalctl -u myapp -o cat            # just the messages, nothing else
journalctl -u myapp -o short-iso      # ISO timestamps, sortable
journalctl -u myapp -o json-pretty    # every field, including the hidden ones
journalctl -u myapp -o verbose        # the same, human-readable
journalctl -u myapp --no-pager # for scripts and for copying out-o json-pretty on a single entry is worth doing once. Every message carries a great deal of metadata you never see — the unit, the executable, the PID, the cgroup, the source file in some cases — and any of those fields can then be used as a filter. Two caveats if you are going to parse it: any field of 4096 bytes or more is replaced by null rather than its value unless you add --all, and a message containing non-printable bytes comes back as an array of integers rather than as a string.
-o cat is the one for piping into grep or awk, since it strips the timestamp and hostname that would otherwise confuse a field-based tool.
The setting that decides whether yesterday exists
On some systems the journal is kept in RAM and is thrown away at every reboot. That is why journalctl -b -1 sometimes replies that no such boot exists — exactly when you most want it, after a crash. The journal is persistent only if /var/log/journal exists, and creating the directory is two steps out of three: journald goes on writing to /run until it is told to move across, and the flag it checks is /run/systemd/journal/flushed. Create the directory, then run sudo journalctl --flush, or reboot. Check for that file rather than for the directory.
journalctl --list-boots           # if only one line, it is not persistent
sudo mkdir -p /var/log/journal
sudo systemd-tmpfiles --create --prefix /var/log/journal
sudo systemctl restart systemd-journaldOr set it explicitly in /etc/systemd/journald.conf with Storage=persistent. Either way, do it on a new server before you need it, not after.
Stopping it eating the disk
journalctl --disk-usage
sudo journalctl --vacuum-size=500M      # keep at most 500 MB
sudo journalctl --vacuum-time=30d       # discard anything older than 30 days
sudo journalctl --verify # check the journal files are intactVacuuming is a one-off. To make the limit permanent, set it in /etc/systemd/journald.conf:
[Journal]
Storage=persistent
SystemMaxUse=500M
MaxRetentionSec=1monthBy default the journal takes up to 10% of the filesystem, clamped to a maximum of 4 GiB — so on a small VPS the percentage is what bites, and above roughly a 40 GB filesystem it is a flat 4 GiB no matter how large the disk gets. It is a common answer to “what filled the disk” — see Disk Space.
Common problems
| Symptom | Cause |
|---|---|
| You see only your own messages | Not in the systemd-journal or adm group; use sudo, or add yourself |
-b -1 says no such boot | The journal is not persistent — see above |
| A service logs nothing | It writes to its own file instead; check its unit for StandardOutput= |
-p err is empty on a machine that is plainly broken | PRIORITY is optional and supplied by the sender; an entry without one matches no level except debug, and an application that records severity inside a JSON message has none at all: The Life of a Log Line |
| Messages stop during heavy load | Rate limiting — but the numbers in journald.conf are not the numbers in force. The limiter is keyed on the unit, so anything outside a service cgroup is never limited and this is not the explanation for it; the configured burst is raised in proportion to free disk space; and the notice saying how many were dropped is filed under systemd-journald at info and written only once the throttle lifts, so neither -u yourapp nor -p err nor watching live will show it. Look for MESSAGE_ID=a596d6fe7bfa4994828e72309e95d61e, which carries N_DROPPED=. For one noisy service, set LogRateLimitIntervalSec= and LogRateLimitBurst= on that unit rather than raising the global limit: The Life of a Log Line |
A line is inside your --since window and is not returned | Two different timestamps on one machine with one clock. journalctl prints _SOURCE_REALTIME_TIMESTAMP, the time the sending program claims; --since compares __REALTIME_TIMESTAMP, the time journald received it. Under load these diverged by nearly seven seconds, and --utc changes neither: The Life of a Log Line |
| Timestamps disagree with a remote system | Two different problems wearing one symptom. If only the rendering differs, --utc on both ends fixes it. If the clocks differ, --utc leaves them differing by exactly as much, in a format that now looks authoritative on both ends — compare the clocks first: How Time Works on a Linux Machine |
| Output is paged and hard to copy | --no-pager, or set SYSTEMD_PAGER=cat |
Not everything is in the journal. Web servers, databases and anything that manages its own files still write to /var/log, and those need logrotate and grep as before. Checking both is the habit; Reading Logs covers when to look where.
Quick reference
journalctl -u myapp -f              # follow one service
journalctl -u myapp -n 100 --no-pager
journalctl -p err -b                # errors since boot
journalctl -b -1 -p err             # errors from the previous boot
journalctl -k                       # kernel messages
journalctl --since "30 min ago" -g 'timeout'
journalctl --list-boots
journalctl --disk-usage
sudo journalctl --vacuum-time=14dRelated
- Reading Logs — the wider workflow, including the files that are not in the journal
- The Life of a Log Line — the long one, and the page underneath this one. What each field in an entry actually is, which of them the sending program chose and which journald stamped, why a line can be missing with nothing reporting an error, and where the guarantee that makes any of it trustworthy stops
- systemctl — the units whose output ends up here
- systemd Beyond Services — units, targets and drop-ins, and the difference between needing something and waiting for it
- How Time Works on a Linux Machine — why a timestamp is a receipt rather than a fact, and why two machines’ logs can each be honest and still not line up
- Disk Space — when the journal turns out to be what filled it