

The standard way to answer “who logged in as root” is one of three commands: journalctl -t sshd, journalctl _COMM=sshd, or journalctl -u ssh. They are taught interchangeably. Here is a line produced on a test machine by an ordinary unprivileged account — uid 1003, no sudo, no privilege of any kind — and then read back the way anybody would read it:
$ journalctl -t sshd -n1
Sep 04 22:02:37 vm sshd[1800]: Accepted publickey for root from 10.0.0.9 port 22 ssh2

field                claimed by sender    stored by journald      verdict
PRIORITY             0                    0                       accepted
SYSLOG_IDENTIFIER    sshd                 sshd                    accepted
SYSLOG_FACILITY      4                    4                       accepted
_PID                 1                    1800                    overwritten
_UID                 0                    1003                    overwritten
_COMM                sshd                 python3                 overwritten
_EXE                 /usr/sbin/sshd       /usr/bin/python3.11     overwritten
_HOSTNAME            bastion              vm                      overwritten
_SYSTEMD_UNIT ssh.service (none) droppedThe default view is byte-identical to a real sshd line, because the four fields it renders are the four the forger controlled. Of the three commands above, journalctl -t sshd shows this line, and so does every shipper label built from SYSLOG_IDENTIFIER. _COMM=sshd does not, because _COMM says python3. -u ssh does not, because the unit claim was thrown away. Which command you happened to type decides whether you see it.
Nothing was exploited here. This is the system working exactly as designed, and the design is the subject of this page. A journal entry is not a record with fields. It is a record with fields and authors, at least four of them, and the record does not say which author wrote which field. The underscore is the whole convention: _PID is a finding journald made by reading /proc, and PRIORITY is a claim the sender made and journald copied. That single sentence is missing from almost every account of logging, and every filter people are taught matches a field written by somebody other than the program.
What this page does not cover. Reading and filtering the journal day to day is journalctl‘s, and finding the line that matters during an incident is Reading Logs‘s. Getting logs off several machines and into one place is Centralising Logs‘s. Whether two machines’ clocks can be compared at all is How Time Works on a Linux Machine‘s. This page is about one line, and about who decided each part of what you are looking at.
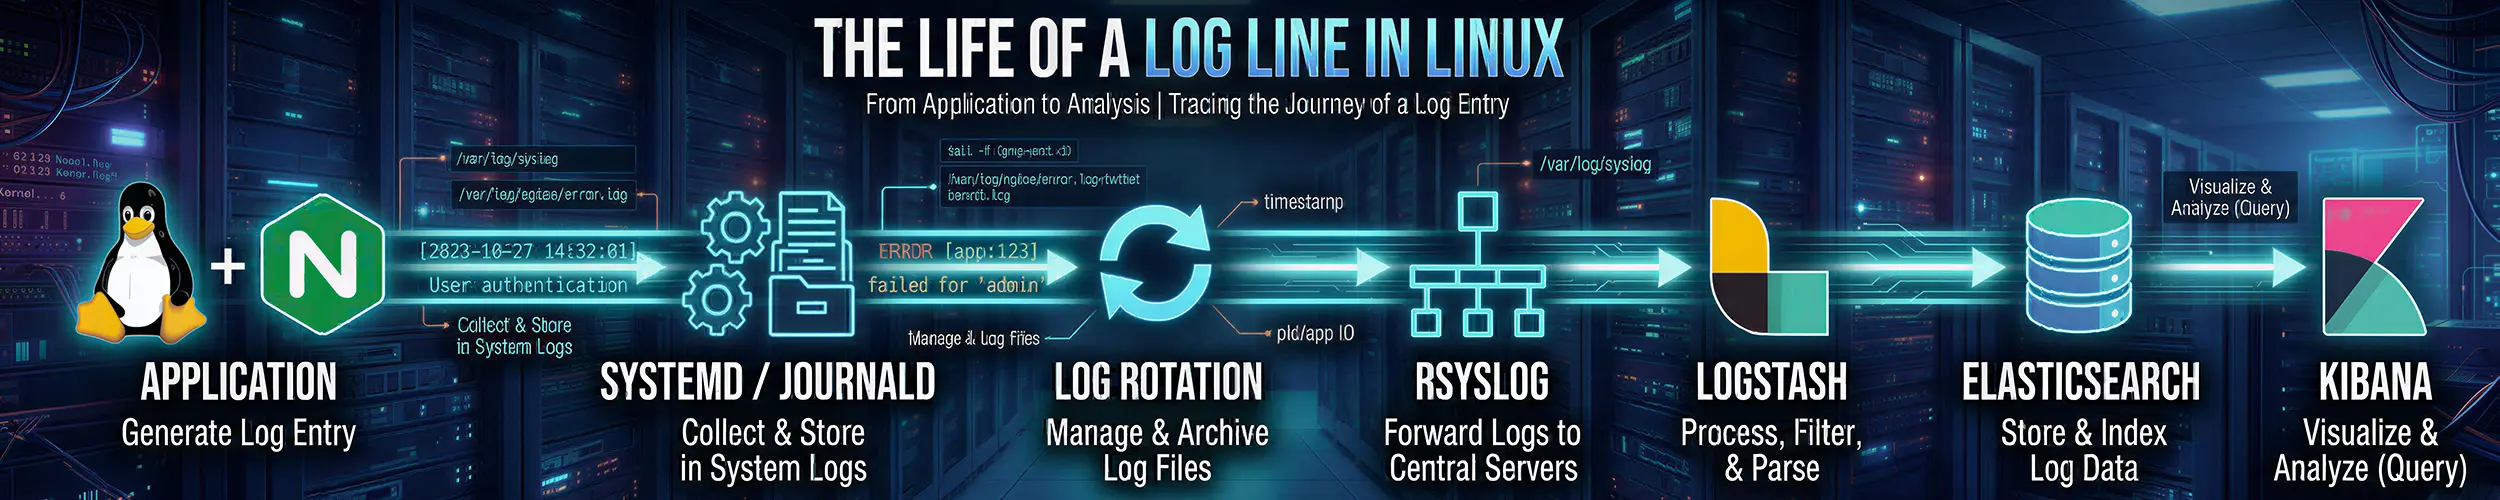
A log line has an order, and every stage of it is owned by somebody who is not the program. Seven stages, each deciding something the program did not:
- the program’s own buffer — whether the line exists yet, and when ·
- the transport — where the record begins and ends, and its ceiling ·
- journald’s stamping — what is a claim, what is a finding, and whether the line survives at all
- storage — how long it exists, and where
- your own tool — which of the stored fields you are shown
- the relay — what is kept, what is renamed, what the record’s identity becomes
- the party who has to be convinced by it.
Ask who framed the line, by resolving a reference the line carries. _STREAM_ID is not a fact about the entry — it is an identifier that resolves to a state file journald keeps for each open connection, holding the decisions being applied to every line on it. Resolve it, and read which of six answers comes back:
grep -l "STREAM_ID=$(journalctl -n1 --all -o export <your filter> | sed -n 's/^_STREAM_ID=//p')" \
/run/systemd/journal/streams/* 2>/dev/null | xargs -r catNeeds root, or membership of systemd-journal with read access to that directory. Read which answer you get, not what is in it.
| What comes back | What it means | Who owns the answer | Stage |
|---|---|---|---|
a state file with PRIORITY, LEVEL_PREFIX, IDENTIFIER, FORWARD_TO_* | journald is framing this line right now from an open stdout connection. The record boundaries are its decision; PRIORITY is a per-stream constant | journald’s stream framer | 2 and 3 |
nothing, and the entry has _STREAM_ID | some journald framed it, but not this one and not now — the process has disconnected, or another machine framed it and the record was relayed here | a journald somewhere; not the program | 6 and 7 |
nothing, no _STREAM_ID, _TRANSPORT=journal | the sender chose its own boundaries and every unprefixed field. PRIORITY here is a claim. So is a container runtime’s driver — and so is a forgery | the program, its library, or a relay wearing its name | 1 and 3 |
nothing, no _STREAM_ID, _TRANSPORT=syslog | syslog(3) or logger. One datagram is one record, with a hard ceiling above which nothing is stored and nothing is reported | the C library and the kernel socket | 2 |
nothing, no _STREAM_ID, _TRANSPORT=kernel | the kernel ring buffer, subject to ReadKMsg= and MaxLevelKMsg= | the kernel | 2 |
nothing, no _STREAM_ID, _TRANSPORT=driver | journald talking about itself. This is where Suppressed N messages lives, which is why that notice is outside every -u and -t filter | journald | 3 |
The second row has two causes — the process disconnected, or another machine framed it. Both are the same answer to the ownership question, and one field separates them: compare _MACHINE_ID with journalctl --header. Everything below is measured on Ubuntu 24.04.4, systemd 255.4, Docker 29.4.3 and rsyslog 8.2312.0, with the source read from the running binaries’ own package.
Stage 1: The program’s own buffer
Before any log system has seen a byte, the C library has already decided when the line leaves. A twelve-line C program printing one line then sleeping one second, three times over, run twice:
stdout is a TTY : reader received 'line 0' at t+0.00s
                  reader received 'line 1' at t+1.00s
                  reader received 'line 2' at t+2.00s

stdout is a PIPE: reader received 'line 0' at t+3.00s
                  reader received 'line 1' at t+3.00s
reader received 'line 2' at t+3.00sA pipe is what journald, a container runtime and a file-tailing shipper all hand a program. The three seconds are destroyed before any log system exists, and nothing downstream can recover them — whoever timestamps the line next is timestamping the flush. This is why a slow request can look instantaneous in the log, why a burst of unrelated events can look simultaneous, and why PYTHONUNBUFFERED=1 and stdbuf -oL exist.
The same stage makes a second decision with much longer consequences: which transport. Whether the library calls syslog(3), writes to stdout, or uses sd_journal_send changes the field set of every record that results. And it decides something people spend years working around. Here is a structured-logging application — one JSON object per line, with its own level field, which is how most modern applications log:
journald PRIORITY=6   app level='info'    request_id='r-0000'
journald PRIORITY=6   app level='error'   request_id='r-0001'
journald PRIORITY=6   app level='error'   request_id='r-0002'

journalctl -t checkout -p err              ->  0
lines the application itself called error -> 2Nothing anywhere in the pipeline derives PRIORITY from an application’s own severity field. Not at this stage and not at any later one. The severity the application computed and the severity you filter on are two schemas that never meet, which is the real reason -p err is useless against most modern software — not, as it is usually put, because “the service logs everything at info”.
There is exactly one mechanism that bridges them, and it costs one character per line. journald’s stream transport has a level-prefix mode in which a leading <N> sets the entry’s priority and is consumed rather than stored:
PRIORITY=3  MESSAGE='payment gateway timeout after 30s'
PRIORITY=6 MESSAGE='GET /orders 200 in 12ms'That is SyslogLevelPrefix=, on by default for services. The application has to emit the prefix; nothing infers it.
Verify: run your service under stdbuf -oL and see whether the timestamps change. If they do, every latency you have ever read out of that log was the library’s flush, not the event.
Stage 2: The transport, and where the record begins and ends
Stage 1’s choice of transport decides who draws the boundaries around a record. There are three, and they disagree.
A stdout stream is a byte stream, and journald splits it on newlines. An eight-line stack trace written to stdout becomes eight journal entries, each with its own timestamp and its own priority, tied together by nothing a default output format shows. The same trace written to a file stays eight adjacent lines and grep -A3 works. Through the native API it is one entry with seven embedded newlines, and the application’s own ORDER_ID alongside it:
through stdout : 8 entries, __SEQNUM 417-424, all sharing
                 _STREAM_ID=ad4ecffaded646ffa7af8b9ae73ba56d
                 journalctl -g IllegalStateException  ->  1 of the 8

through a file : 8 adjacent lines            grep -A3 works

through native : 1 entry, 7 embedded newlines
journalctl ORDER_ID=88213 -> the whole traceThe file preserves adjacency; the journal preserves identity. Neither preserves both, and no stage downstream can recover the one that was thrown away here. This is the decision people spend the most effort undoing without knowing they are undoing it.
A syslog datagram is always exactly one record, and it has a hard ceiling. The native transport lets the sender choose its own boundaries and its own fields. And every one of them has a size above which something is thrown away:
| Where | Ceiling | What happens above it | Marked? |
|---|---|---|---|
| stdout stream | LineMax, 48K shipped | cut at 49152 bytes; the remainder becomes the next entry | yes — _LINE_BREAK=line-max, shown by no default format |
| syslog datagram | ~208 KiB (the socket) | EMSGSIZE; nothing is stored | no — logger reports nothing |
| native, inline | ~208 KiB | EMSGSIZE; a real client retries with a sealed memfd | n/a |
journalctl -o json | 4096 bytes per field | the value becomes null | no |
| rsyslog | 8 KiB default | truncated to 8059 bytes | no |
| Docker json-file | 16384 bytes | split into several records | no |
Six ceilings, five different sizes, one marker between them. A 40,000-byte line stored intact by journald reaches a syslog file as 8,059 bytes and a container log file as three records. Measured: 131,072 bytes went through the syslog socket and 212,992 was refused. journald’s own enumeration of why it ends a line is nul, line-max, eof and pid-change — that last meaning the process writing mid-line changed, which is a record boundary nothing else on the machine would think to look for.
The transport also decides whether a field everybody filters on exists at all. A native-transport entry can have no PRIORITY field. Here is one, run through every severity filter there is:
journalctl -t t16nopri -p emerg    -> 0        -p notice   -> 0
                       -p alert    -> 0        -p info     -> 0
                       -p crit     -> 0        -p debug    -> 1
                       -p err      -> 0
-p warning -> 0 (no -p) -> 1Visible at debug only because -p debug adds no match at all — the priority set starts at 0xFF and the function returns early. Every other value builds an OR of literal PRIORITY=N matches, and an entry with no such field matches none of them. An entry that reads perfectly with no filter is invisible to the seven filters you are most likely to type.
Verify: journalctl -o export -n1 <your filter> | grep -c '^PRIORITY='. If that is 0, no -p will ever find the line again.
Stage 3: What is a claim, what is a finding, and what does not survive
This is the stage the opening exhibit came from, and it does three things.
The trust split. journald reads the sender’s credentials from the socket, reads /proc/PID, and writes what it finds into the underscore-prefixed fields, discarding anything the sender tried to set there. Everything else is copied verbatim. That is the entire integrity model, and it is worth stating in the form the reader needs: an underscore means journald went and looked; no underscore means somebody said so.
A race the split does not survive. _EXE and _CMDLINE are read from /proc after the message arrives. The same program sending the same message twice — once exiting immediately, once lingering three seconds — produces entries that differ in exactly those two fields:
process lingers 3s    ->  _EXE=/home/svc/payment-gateway-worker  _CMDLINE=...
process exits at once ->  (no _EXE)  (no _CMDLINE)

journalctl /home/svc/payment-gateway-worker -> 0 entries for the secondNothing in the short-lived entry distinguishes “this field is missing” from “this process had no executable”. Anything short-lived — a cron job, a health check, a container that crashes on start — is exactly the thing you most want to find by binary, and exactly the thing that cannot be found that way.
And the rate limiter, which is where lines are destroyed. The precondition first, because it is a finding in itself: the limiter sits inside a test for the sender’s unit, so a process not in a service cgroup is never rate limited at all. A sidecar, a cron job, a shell loop have no ceiling. With a unit, and RateLimitIntervalSec=5s RateLimitBurst=20:
sent    : 200 messages at priority err
stored  : 75
dropped : 125, contiguous, request 075 through 199

notice  : 'Suppressed 125 messages from t06dbg2.service'
          MESSAGE_ID        a596d6fe7bfa4994828e72309e95d61e
          N_DROPPED         125
          SYSLOG_IDENTIFIER systemd-journald
          PRIORITY          6
_SYSTEMD_UNIT (none)Five things in that block matter, and four of them are invisible from where the reader is standing. The configured burst of 20 became an effective 75, because journald raises the burst with free disk space — the number in your configuration is a floor, not the limit. The gap is contiguous and at the end, so a reader scrolling the log sees a plausible run of errors that simply stops. The notice is filed under journald’s own identity, so journalctl -u t06flood.service and journalctl -t t06flood both return zero drop notices: the reader who has correctly narrowed to the failing service is the one who cannot see that anything was lost. The notice is PRIORITY=6, so -p err cannot show it, and neither can any alert built on -p err. And it is written when the throttle lifts, not when the drop happens — during the incident there is nothing at all.
There is a machine-readable handle, and it is the one thing to take away from this stage:
journalctl MESSAGE_ID=a596d6fe7bfa4994828e72309e95d61e -o json | grep N_DROPPEDTwo more identifier traps live at this stage, and both return a confident wrong answer rather than an error. _COMM comes from /proc/PID/comm, which the kernel caps at fifteen characters:
journalctl _COMM=payment-gateway-worker   (the real name)   -> 0
journalctl _COMM=payment-gateway          (15 characters)   -> 5
journalctl -t payment-gateway-worker (the identifier) -> 2Three filters, three answers, no error from any of them. And -u NAME is not “only this unit”: it expands to a four-way disjunction over _SYSTEMD_UNIT, COREDUMP_UNIT, UNIT= written by PID 1, and OBJECT_SYSTEMD_UNIT= written by any daemon running as root. Lines the unit never wrote are inside that filter, and lines it did write under another identity are outside it.
Verify: journalctl -o verbose -n1 <your filter> and read the underscores. Every unprefixed field is something the sender chose, including the identifier you are filtering on.
Stage 4: How long the line exists, and where
The rule everybody knows is that /var/log/journal existing makes the journal persistent. That is necessary and it is not sufficient. journald writes to /run/log/journal — memory — until a flag file appears, and that flag is created by a separate unit, systemd-journal-flush.service. On the machine under test:
persistent file last modified: 2026-09-04 16:09:39
volatile   file last modified: 2026-09-04 22:15:30
now: 2026-09-04 22:16:02/var/log/journal had existed for six hours. Every entry written in those six hours was in memory, and would have gone at the next reboot. That is the container case, and it is also the early-boot case, the rescue-target case, and the case where somebody masked the flush unit because it looked inert.
Then retention, which is set by a default nobody has read. The shipped SystemMaxUse= is empty, and the compile-time default is CLAMP(fs_size / 10, 1 MiB, 4 GiB). “Ten per cent of the filesystem” is only true between about 10 MiB and 40 GB of filesystem; above that it is a flat 4 GiB, which on a modern server is a much smaller fraction than anyone assumes. journald then aims for roughly eight files inside that budget, which is why SystemMaxFiles= and MaxFileSec= interact with the size limit in ways a single number does not describe.
And then vacuuming, which is not what its name suggests. --vacuum-time deletes whole archived files and can never touch the active one:
$ journalctl --vacuum-time=1s
Deleted archived journal /var/log/.../system@6757a777-...journal (4.0M).
Vacuuming done, freed 4.0M of archived journals.

$ journalctl --list-boots
0 fed12d88... (the current one, and the only one left)One file, containing the entire previous boot, gone; everything in the active file untouched. Vacuum is neither a scalpel nor a shredder — it is a file deleter with a granularity you do not control. It will refuse to free the thing you asked it to free and will silently take a week of history you needed. The familiar symptom of -b -1 reporting no such boot arrives here by a route that has nothing to do with persistence: the journal was persistent the whole time.
Verify: journalctl --header | grep -c 'File path: /run'. Any non-zero answer on a machine you expect to be persistent means today’s logs are in memory, whatever /var/log/journal looks like.
Stage 5: Which of the stored fields you are shown
journald stored twenty-two fields for an ordinary logger line. The default output renders four. That much is widely known and usually mentioned. What follows it is not.
A message containing bytes that are not printable text behaves differently in every output format — and one of the three is a hazard. A real log line carrying a raw query string, a terminal escape and a truncated UTF-8 sequence:
$ journalctl -t t07bin -n1
Sep 04 22:11:19 vm t07bin[3140]: [33B blob data]

$ journalctl -t t07bin -n1 -o json
"MESSAGE": [71,69,84,32,47,111,114,100,101,114,115,63,113,61,0,1,27,32,...]

$ journalctl -t t07bin -n1 -o cat
GET /orders?q= HTTP/1.1 -> 500 <- control bytes, straight to your terminalThree formats, three behaviours. The first hides the message. The second returns MESSAGE as a JSON array of integers rather than a string, so any consumer doing string operations on it breaks and any shipper expecting a string drops the entry. The third writes attacker-influenced control bytes into your own terminal session. There is no format that shows you the message safely and completely; you have to choose which failure you want.
And -o json silently discards large values. Any single field of 4096 bytes or more becomes null unless --all is passed. The threshold applies to the whole KEY=value pair, which is why the boundary lands in an odd place:
datum 4080 bytes:   -o json => 4080 bytes    -o json --all => 4080 bytes
datum 4088 bytes:   -o json => null          -o json --all => 4088 bytes
datum 8192 bytes: -o json => null -o json --all => 8192 bytesMESSAGE= is eight bytes, so 4080 passes and 4088 does not. A pipeline built on journalctl -o json without --all throws away exactly the long messages — stack traces, request dumps, SQL — that it was built to capture.
The last one is the most consequential, because it is about time and it is silent. An ordinary syslog line carries three timestamps, and they are three different claims by three different parties:
SYSLOG_TIMESTAMP            'Sep  4 22:14:13 '   the SENDER, as text, no year, no zone
_SOURCE_REALTIME_TIMESTAMP  1788560053996197     the kernel's stamp on the message
__REALTIME_TIMESTAMP 1788560053996290 when JOURNALD wrote the entryThey agree while nothing is wrong. Stop journald for seven seconds while the application keeps logging, which is what a busy machine does to itself:
MESSAGE   _SOURCE_REALTIME_TIMESTAMP   __REALTIME_TIMESTAMP     skew
event 0             1788560010862596       1788560017763677     6.90s
event 1             1788560011162864       1788560017764132     6.60s
event 2             1788560011463094       1788560017764156     6.30s

journalctl -t t09stall --utc --since "2026-09-04 22:13:34"  ->  3 entries
journalctl -t t09stall --utc --until "2026-09-04 22:13:34"  ->  0 entries
all three display as 22:13:30The application emitted them 0.3 seconds apart. journald wrote them 0.4 milliseconds apart, nearly seven seconds late. --since and --until compare __REALTIME_TIMESTAMP, and the timestamp on your screen is _SOURCE_REALTIME_TIMESTAMP. Both answers above are correct; they are answers about two different fields. Narrowing to a window around an incident can show you entries stamped outside it and hide entries stamped inside it, and --utc changes nothing, because this is not about rendering and not about clocks.
The rule that falls out of it is worth memorising. An ordering question needs __REALTIME_TIMESTAMP or __SEQNUM — journald’s own, monotonic within one journald, and the order every reader and every shipper actually receives. A “when did it happen” question needs _SOURCE_REALTIME_TIMESTAMP, which is the sender’s. Using one for the other is silent and wrong.
Verify: journalctl -o json -n5 <your filter> | jq -r '[.__REALTIME_TIMESTAMP, ._SOURCE_REALTIME_TIMESTAMP] | @tsv'. If the columns differ by more than a few milliseconds, every time window you have drawn on this machine was drawn on the wrong field.
Stage 6: The relay, and what the record becomes
Everything so far happened on one machine, between the program and journald. A relay is anything that picks the record up and puts it down somewhere else, and it is owned by neither. The most common relay is also the least visible, because most people do not think of it as a logging component at all: a container runtime.
Here is Docker’s default json-file record, complete — this is the entire thing, nothing elided:
{"log":"payment gateway timeout\n","stream":"stderr","time":"2026-09-04T22:18:28.947817663Z"}
{"log":"order 88213 abandoned\n","stream":"stdout","time":"2026-09-04T22:18:28.947872446Z"}Three keys. No pid, no container name, no image, no severity, no unit. The container id is in the path of the file, not in the records, so every label a shipper attaches to those lines comes from somewhere other than the line. The time is one the runtime invented when it read the bytes, and docker logs without --timestamps hides the timestamp it just made up. The default LogConfig is {"Type":"json-file","Config":{}} — no max-size, no max-file — so the file grows without limit and logrotate is not looking at it.
Two further things happen that no marker records. stdout and stderr are two separate pipes, and the runtime reads them independently:
the program wrote : out1 err1 out2 err2 out3 err3 out4 err4 out5 err5
the file contains : out1 err1 err2 err3 err4 err5 out2 out3 out4 out5

one 40,000-byte line became 3 records, split at exactly 16384 bytes
  docker logs         -> rejoins them, prints 1 line
anything else -> 3 lines, and the only marker is a missing trailing newlineThe runtime’s timestamps on those out-of-order records are microseconds apart, so sorting by time does not restore the program’s order either. Interleaving is destroyed at this stage and there is no field anywhere that records what the order was.
Switch to the journald log driver and something more interesting happens — the trust split of stage 3 turns inside out:
MESSAGE='payment gateway timeout'
  PRIORITY=3   SYSLOG_IDENTIFIER=checkout   _TRANSPORT=journal   _COMM=dockerd
  sender-supplied: CONTAINER_ID  CONTAINER_ID_FULL  CONTAINER_NAME
CONTAINER_TAG CONTAINER_LOG_ORDINAL CONTAINER_LOG_EPOCHPRIORITY=3 for stderr and 6 for stdout: severity decided by file descriptor, which is why a container that writes an ordinary progress message to stderr fills your error dashboard. _COMM is dockerd because the sender is dockerd. Every field naming your application is a CONTAINER_* field, and every one of those is unprefixed — a claim. Inside a container, the underscore rule tells you about the runtime and nothing whatever about your program.
The syslog relay is simpler and loses more. The same journal entry, twenty fields, through rsyslog:
journal entry : 20 fields
syslog line   : Sep  4 22:20:51 vm t13[4832]: order 88213 abandoned    (8 tokens)

  REQUEST_ID=r-0001   gone      _BOOT_ID    gone      sub-second precision  gone
  CUSTOMER=alice      gone      __CURSOR    gone      the year, the timezone  gone

  sent    stored in journal    written to the syslog file
   8100        8090             8060   tail intact: False
40000 39991 8059 tail intact: FalseEvery structured field the application went to the trouble of attaching is discarded, because the format has nowhere to put it. RFC 3164 has no year and no timezone, so a line shipped across a date boundary or between regions arrives ambiguous by design. And the truncation is silent in both directions: nothing at the sending end reports it and nothing at the receiving end can detect it.
Verify: write a line with an application field, then look for it at the far end. If REQUEST_ID survives locally and not centrally, you know the shape of everything else you are losing.
Stage 7: The party who has to be convinced
Every account of logging ends when the line reaches the store. That is where the mechanism ends. The reader’s problem ends one step further out, because somebody has to be convinced by the line: the auditor asking who logged in as root, the incident review deciding whether the outage began at 14:02 or 14:09, the customer told their order was never received. In most of those the person who has to be convinced was not on the machine, was not there at the time, and cannot check anything you tell them.
The good news first: the export format loses nothing. Twenty fields leave the machine and twenty arrive, cursor and sequence number and boot id included. The shipper is not where the record degrades.
Now the same forgery from the top of this page — the one journald refused locally — posted at the log server’s ingest port instead of the local socket:
$ curl -X POST --data-binary @forged.export \
       -H 'Content-Type: application/vnd.fdo.journal' \
       http://127.0.0.1:19532/upload
OK.                                              HTTP 202, no credentials presented

$ journalctl --file=.../remote.journal -t sshd -n1 -o verbose
    _UID=0          _PID=1              _COMM=sshd
    _EXE=/usr/sbin/sshd                 _SYSTEMD_UNIT=ssh.service
    _HOSTNAME=web1.prod                 _MACHINE_ID=00000000000000000000000000000002
MESSAGE=Accepted publickey for root from 10.0.0.9 port 22 ssh2Every underscore-prefixed field is exactly what was posted, including the five journald had overwritten on the origin machine. The underscore rule is a local rule enforced by a process that reads /proc. Across a network there is no /proc to read, and an underscore means only “the sender used that field name”. A central store presents witnessed records and reported records in the same font, and -o verbose gives you no way to tell them apart.
The second problem at this stage is absence, which is worse because it has no appearance at all. A gap in a central store can be any of seven things: the application’s stdio buffer; a datagram over the socket ceiling; the rate limiter, whose notice is at info under another identity; a vacuum that took a whole file; a -p filter excluding entries with no priority; a shipper resuming from a cursor the journal has already rotated past; or nothing having happened. Seven causes, one appearance. Exactly one of the seven leaves a machine-readable trace — the rate limiter’s N_DROPPED — and that record stays on the origin machine unless somebody deliberately ships it.
The shipper’s durability story is one line in a state file:
# This is private data. Do not parse.
LAST_CURSOR=s=f39572f4...;i=b78;b=fed12d88...;m=64ee665d;t=65aafaecb29e5;x=86380b25One cursor. On restart the shipper resumes after that entry — and if the local journal has rotated or been vacuumed past it, which stage 4 showed happens on a schedule nobody watches, the gap is never sent and nothing at either end records that a gap existed.
There is a mechanism designed for exactly this audience, and it is off in the only sense that matters. Forward Secure Sealing: journalctl --setup-keys produces a sealing key and a separate verification key, journald writes Tag objects into the journal as it goes, and journalctl --verify reports tampering. Its whole design assumes the verification key lives off the machine, with the party who has to be convinced. Seal=yes is the shipped default, and on a machine with no key it does nothing: the header on the machine under test reads Tag objects: 0. The seal is configured on and absent, which is the worst of the three available states because it reads as protection.
Verify: you cannot, from the central store — that is the finding. What you can do is decide what your logs are for before you build the pipeline. If they are for you at three in the morning, local persistence and one good query beat everything, and none of this stage applies. If they are evidence for somebody else, then a shipping topology with a shared credential, no per-host identity and no sealing does not produce evidence, and no amount of retention will make it produce evidence.
A worked diagnosis
A checkout service failed for eleven minutes. The log has four error lines at the start of it and then nothing until recovery. The application team says it was throwing exceptions the whole time. Start at the entry itself:
$ grep -l "STREAM_ID=$(journalctl -n1 --all -o export -t checkout \
    | sed -n 's/^_STREAM_ID=//p')" /run/systemd/journal/streams/* | xargs -r cat

# This is private data. Do not parse
PRIORITY=6
LEVEL_PREFIX=0
FORWARD_TO_SYSLOG=1
STREAM_ID=c1115490e59c4f87b029f9584e50dfe9
IDENTIFIER=checkoutThree findings before touching anything else. PRIORITY=6 is a per-stream constant — every line this service writes is info, whatever the application thinks its severity is, so the four “error lines” were found by their text and not by -p err, and there is no reason to think they were the only ones. LEVEL_PREFIX=0 says the one mechanism that could fix that is switched off. FORWARD_TO_SYSLOG=1 says a second, lossier copy of all of it is being made somewhere the team has probably forgotten.
The gap is stage 3, and it names itself if you know where it is filed:
$ journalctl MESSAGE_ID=a596d6fe7bfa4994828e72309e95d61e -o json --since -1h \
    | jq -r '[.__REALTIME_TIMESTAMP, .N_DROPPED, .MESSAGE] | @tsv'

1788560017763677 1841 Suppressed 1841 messages from checkout.serviceEighteen hundred and forty-one lines destroyed, and the notice sits at PRIORITY=6 under systemd-journald, which is why journalctl -u checkout — the correct, careful thing to have typed — showed a service that went quiet. It was not quiet. It was louder than the limiter allowed, and the record of that is filed under a different name at a severity the reader’s filter excludes.
One more thing follows from the first output, and it explains the part that looked like a clock problem. The four surviving errors display timestamps inside the outage window but were returned by a --since bound outside it, because journald was behind while it was being flooded. Nothing here was a clock error, a missing log statement or a broken service. Three stages each threw something away, none of them told anybody, and the one that kept a receipt filed it where the filter could not reach.
What everybody says, and what it actually matches
| The advice | The field it matches, and who wrote that field | Stage |
|---|---|---|
Set the application’s log level to error | nothing anywhere derives PRIORITY from an application’s own severity field; only a <N> prefix does | 1 |
-p err shows what is wrong with the machine | PRIORITY — sender-supplied and optional. An entry without it is invisible to every level except debug | 2, 3 |
Count -p err lines as a health metric | the count falls on the day journald starts discarding, because the drop notice is info | 3 |
-u NAME shows only that unit | a four-way disjunction including OBJECT_SYSTEMD_UNIT=, writable by any root daemon | 3 |
_COMM=name finds it by executable | /proc/PID/comm, capped by the kernel at fifteen characters | 3 |
journalctl /path/to/binary | _EXE, read from /proc after the message arrived — absent for anything short-lived | 3 |
/var/log/journal exists, so the journal is persistent | true only after the flush unit runs; until then every entry is in /run | 4 |
--vacuum-time trims old entries | deletes whole archived files and never the active one | 4 |
--since and --until bound what you see | __REALTIME_TIMESTAMP; the timestamp on screen is _SOURCE_REALTIME_TIMESTAMP | 5 |
-o json gives you the entry | any field of 4096 bytes or more becomes null without --all | 5 |
| A log line is one line | boundaries belong to journald at 48K, the container runtime at 16K, rsyslog at 8K | 2, 6 |
docker logs shows what the container printed | stdout and stderr are reordered against each other, and the timestamp was invented at read time | 6 |
| Shipping moves your logs somewhere safe | the syslog path discards every structured field; the export path keeps all of them | 6 |
| The central store records what happened | it records what it was told; across a network an underscore means only that the sender used that name | 7 |
The one error, and everything it generates
Every mistake above comes out of one sentence:
a log entry is a record, and its fields are metadata belonging to the log system
Watch it generate. If the fields are one pile belonging to one owner, then filtering on any of them is equivalent — so -t sshd, _COMM=sshd and -u ssh get taught interchangeably, and which one you type decides whether you see a forgery. If the log system owns every field, then no field can be a claim — so nothing tells you where trust starts and stops, and nobody notices that it stops at the first network hop. If the record is one object, then its boundaries are the program’s — so nobody expects a stack trace to arrive as eight entries or a long line to arrive as three. If the record is complete, then absence means nothing happened — so a gap with seven possible causes gets read as silence. And if a field is a fact rather than an assertion by somebody, then there is no reason to ask when it was made — so two timestamps written by two parties get used interchangeably until a window quietly returns the wrong entries.
The one-sentence test for anything else you read on this subject: does it ever say which party wrote the field it is telling you to filter on? Almost nothing does, and the advice is wrong at precisely the points where that party is not who you assumed.
The absences are the other half of it, and they are worth listing because each one is a place where the pipeline destroys something and says nothing: a stdio buffer holding three seconds of events; a datagram over the socket ceiling, refused by the kernel with the sending library reporting nothing; rsyslog’s truncation at 8,059 bytes; a container runtime’s split at 16 KiB, whose only marker is a missing newline; -o json nulling any field over 4096 bytes; an entry with no PRIORITY, unreachable by every severity filter; and a shipper resuming from a cursor the journal has already rotated past. Seven silent losses. Two markers exist in the whole pipeline — _LINE_BREAK=line-max, which no default output format shows, and the rate limiter’s N_DROPPED.
That second one is the interesting one, because it is the single place where the system has visibly half-fixed this. journald does not just drop your messages: it counts them, writes the count into a field, and files the notice under a stable MESSAGE_ID that will still mean the same thing in ten years. Somebody thought carefully about a machine-readable admission of data loss. And then filed it at info, under journald’s own identity, outside every filter a person narrowing down an incident would use, and only once the incident was over. The mechanism to tell you exists, is well designed, and is aimed away from you.
Which is the whole subject in one line. Every field in a log entry has an author, the record does not say who, and the one rule that makes any of it trustworthy stops at the edge of the machine.
Related reading
- journalctl — the day-to-day reference: filters, output formats and time ranges
- Reading Logs — finding the line that matters when something has just broken
- Centralising Logs — the practical build of stage 6, and the label mistake that ruins it
- How Time Works on a Linux Machine — the clocks underneath stage 5, and why two machines’ timestamps may not be comparable at all
- systemd Beyond Services — units and cgroups, which is what the rate limiter is keyed on
- Containers, All the Way Down — what a container runtime is, and why it ends up between your program and its output
- The Life of a File Descriptor — stdout and stderr as two objects, which is what stage 6 reorders
- Monitoring Without a Full Stack — alerting on logs, and why silence needs its own alarm