

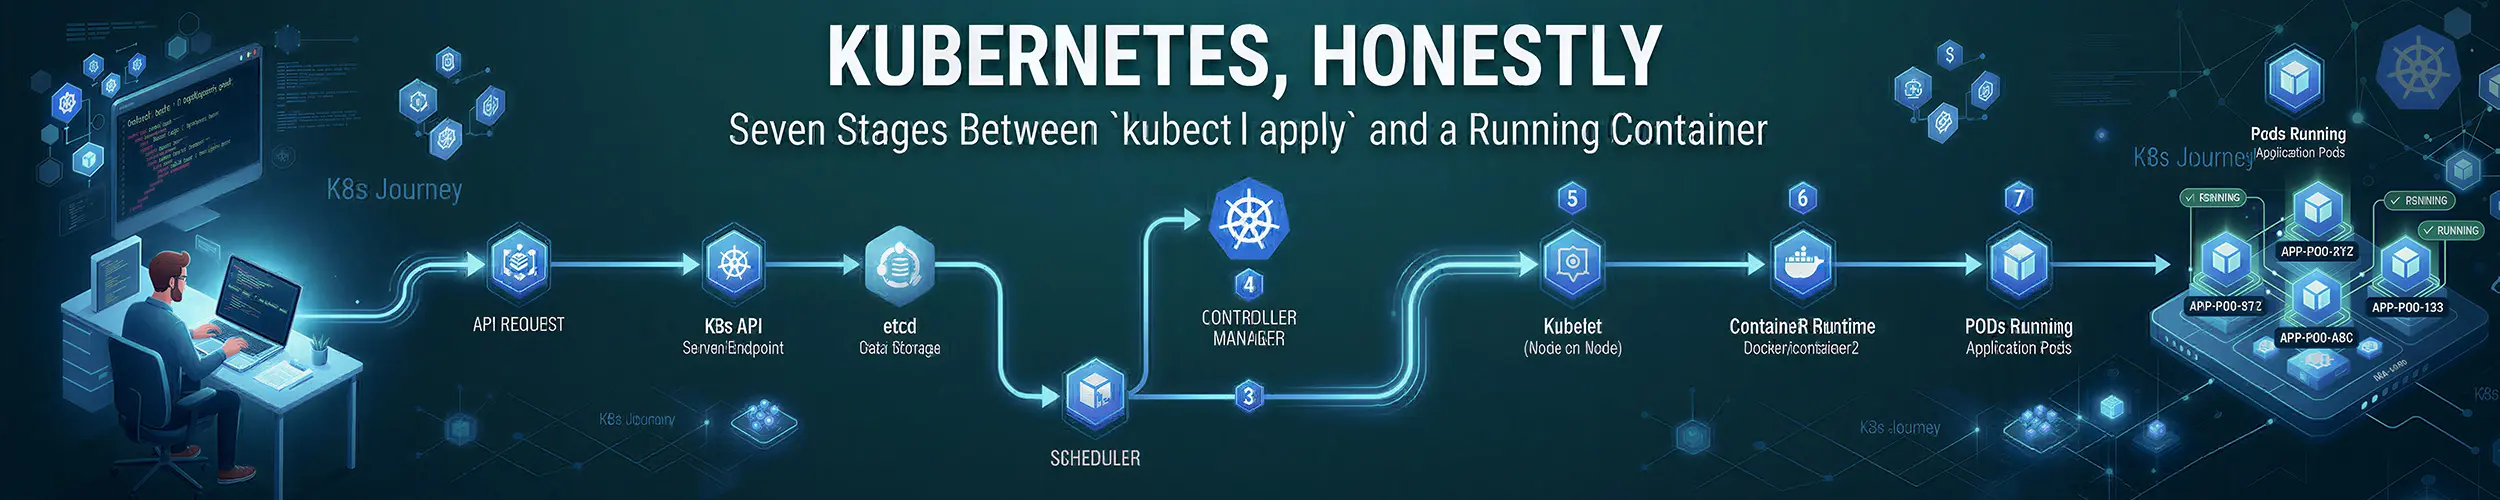
You run kubectl apply -f deployment.yaml, wait, and a container is running on a machine you did not choose. Between those two moments sit seven stages, exactly two synchronous calls, and one shared database — and almost everything written about this describes a different system.
This page goes underneath containerising a service. That one gets your application into an image and running under a container runtime; this one is what happens when something else decides where and when to run it. Below stage 6 it hands off entirely to Containers, All the Way Down, which owns the runtime layer and explains it properly.
Scoped, because the versions move quickly here: Kubernetes v1.37, released 26 August 2026, with notes where a behaviour changed recently enough that v1.35 and v1.36 differ. Kubernetes ships three minor releases a year and supports each for about fourteen months, so a cluster two releases behind is normal and supported — and several things below changed inside that window.
What this does not cover
A self-managed cluster is assumed — kubeadm, k3s, kind, or anything where you can read the control plane’s own configuration. On EKS, GKE and AKS, stages 1 to 4 are physically unobservable: there is no API server pod in kube-system, no scheduler log, no reachable etcd, and no way to read the enabled admission plugins. That does not make this article useless to you; it makes the diagnostic hinge below more valuable, because a Pod’s own fields are then the only instrument you have for the half of the path you cannot see.
Service networking is a different article. kube-proxy, iptables versus nftables, and the CNI dataplane are not stages between kubectl apply and a running container — a container runs perfectly well with no kube-proxy at all. The only networking here is the EndpointSlice controller in stage 7, and it is here because it is a controller, not because it is networking.
Helm and kustomize are stage zero. They change what you send, not what happens to it. One exception is called out in stage 1, because it produces an error message naming something you have never heard of.
Also out: authorization in depth, and etcd’s internals. Both are their own subjects and neither is a stage.
The seven stages, and the question that tells you which one you are in
kubectl— the kubeconfig, the discovery cache, and what actually goes on the wire.- The API server — authentication, authorization, mutating admission, validation, validating admission, and the write to etcd. All one stage.
- Controllers — a Deployment becomes a ReplicaSet becomes a Pod, by the same pattern every operator you will ever meet also uses.
- The scheduler — filter, score, and a write of one field.
- The kubelet — admission, the sync loop, volumes, and the sandbox.
- The CRI boundary — where this article ends and the runtime’s begins.
- Readiness and the EndpointSlice controller — when traffic actually arrives.
The frame, and it is the whole subject in one sentence. On this path there are exactly two synchronous calls: kubectl to the API server, and the kubelet to the container runtime. Everything in between is one process writing a field and another process noticing, through a watch on a single database that only the API server may touch. Nothing is sent anywhere. Nothing is notified.
Which gives the hinge: ask who wrote what. .spec is yours. .spec.nodeName belongs to the scheduler and to nothing else. .status on a Pod belongs to that node’s kubelet.
kubectl get pod -l app=myapp -o custom-columns=\
'NAME:.metadata.name,NODE:.spec.nodeName,PHASE:.status.phase'No Pod object at all — the failure is above the Pod, in stages 1 to 3. Your intent never became a Pod. Stop looking at pods and look at the owner: kubectl describe deploy, kubectl get rs, kubectl get events.
A Pod with .spec.nodeName empty — stage 4, and only stage 4. The scheduler has not bound it, no machine has been contacted, no image has been pulled, and nothing anywhere on any node has happened yet. status.conditions carries the scheduler’s own reason under PodScheduled.
.spec.nodeName set but .status thin or empty — the stage 4 to 5 handoff. A node was chosen and that node’s kubelet has not picked the Pod up. This is a node problem, not a scheduler problem; the scheduler did its job and wrote its field.
.status populated — a kubelet is talking to you, and its conditions say how far down the node-side path it got. The table in stage 5 reads them.
Stage 1 — kubectl
Before anything leaves your machine, kubectl has to work out which cluster you mean, what resource kinds that cluster serves, and what shape of request to build. Two of those three are cached on your laptop, and one of the caches is the reason for a failure that looks like a server problem and is not.
kubectl config current-context        # which cluster and namespace, before anything else
kubectl api-resources                # what this cluster serves — and what gets cached
kubectl apply -f manifest.yaml -v=8 --dry-run=serverThat last command is worth more than any diagram of this stage. It prints the discovery requests, the exact HTTP verb and path, the request body and the response, and persists nothing.
The cache that makes a resource disappear for six hours
kubectl caches the cluster’s API surface under ~/.kube/cache, in two subtrees — discovery/ and http/ — with a six-hour TTL. The directory is overridable with --cache-dir or the KUBECACHEDIR environment variable.
The consequence bites the first time you install a CRD:
$ kubectl apply -f crd.yaml
customresourcedefinition.apiextensions.k8s.io/widgets.example.com created

$ kubectl get widgets
error: the server doesn't have a resource type "widgets"

$ rm -rf ~/.kube/cache/discovery
$ kubectl get widgets
No resources found in default namespace.The server does have that resource type. It has had it since the first command returned. The error message is kubectl reporting the contents of a file on your own disk, and it will keep reporting it for up to six hours. This is a stage 1 failure that presents as a stage 2 failure, and it is the clearest possible argument for knowing which stage you are in.
Two kinds of apply, and they fight
kubectl apply still defaults to client-side apply. It reads the annotation kubectl.kubernetes.io/last-applied-configuration off the live object, diffs it against what you are submitting, and sends a patch. Server-Side Apply has been stable since v1.22 and is available with --server-side, but making it the default is a separate piece of work that has not landed.
The two models are not two implementations of the same idea. Client-side apply tracks your last submitted state; server-side apply tracks per-field ownership, recorded in metadata.managedFields. Point both at the same object and they will fight, because each considers a field it does not know about to be someone else’s mistake.
This is the one place Helm belongs in this article. Helm applies with its own field manager. A kubectl apply --server-side against a Helm-managed object produces a conflict error naming a manager you have never configured and cannot find in your own manifests. It is not a bug and the object is not corrupt; two writers have both claimed a field, and one of them has to yield with --force-conflicts or stop managing it.
kubectl get deploy myapp -o yaml --show-managed-fields | grep -A3 manager:
kubectl apply --server-side -f manifest.yaml          # migrate one object
kubectl get deploy myapp -o kyaml # KYAML: stable in v1.37That last one is new enough to be worth naming. KYAML went stable in v1.37: a subset of YAML in which every file is still valid YAML, but the type-coercion ambiguities are gone — the ones that turn a country code into a boolean and a version string into a number. It has been the default output format since v1.35 and can be turned off with KUBECTL_KYAML=false.
Stage 2 — The API server
One HTTP request arrives, and six things happen to it before you get a response. The order matters, almost every article gets it wrong, and the mistake it produces is not academic: it sends people to debug the wrong component.
The order, and why etcd is not a stage of its own
- Authentication — who are you.
- Authorization — may you do this verb to this resource.
- Mutating admission — webhooks and built-in plugins change your object. Defaults, injected sidecars, added labels.
- API validation — the schema and semantic checks, run on the object as mutated.
- Validating admission — webhooks and CEL policies that may reject but not change.
- The write to etcd.
Validation sits between the two admission phases, not before them. That is why a mutating webhook can produce an object your manifest never described and your error message names a field you did not write.
And step 6 is a function call inside the same request handler. There is no state in which the API server has accepted your object and etcd does not have it. Making etcd a stage of its own would invent a seam you can never stand in — and a reader trying to debug there would find nothing to debug. What is worth knowing instead is that the API server is the only component that talks to etcd at all. That single fact is why every other component is stateless, why you can restart any of them without ceremony, and why restoring etcd is the only restore that exists.
A correction to that last sentence, added later. Restoring etcd is the only restore that exists — and the restore recipe in the Kubernetes documentation hands your data back on a rewound clock. etcdutl snapshot restore starts the new cluster reissuing revision numbers that clients already hold, so watches resume with no error and the wrong content, and controllers act on objects that no longer exist. Two flags prevent it — --bump-revision and --mark-compacted, both available since etcd 3.5.10 in October 2023 — and neither the Kubernetes restore instructions nor k3s’s --cluster-reset-restore-path passes them. etcd, Honestly is the page for that, and for a second thing this one does not mention: etcd_disk_wal_fsync_duration_seconds is a stopwatch held by the etcd process, so a control-plane pod with a CPU limit reports a fifteenfold disk degradation on a disk that has not changed.
Two admission plugins are enabled by default now and much of the older writing predates both. PodSecurity — Pod Security Admission, which replaced PodSecurityPolicy when that was removed in v1.25 — and ValidatingAdmissionPolicy, which evaluates CEL expressions in the API server with no webhook, no certificate, and no extra deployment to fail.
kubectl auth can-i --list                    # stage 2, step 2, for you
kubectl auth can-i create pods --as=system:serviceaccount:prod:deployer

# Is the control plane itself healthy, component by component?
kubectl get --raw='/readyz?verbose'The second command is the one to reach for when a controller’s service account is the thing being refused. Authorization failures in stage 3 look nothing like authorization failures in stage 2, because in stage 3 nobody is watching the terminal.
Stage 3 — Controllers
Your kubectl apply has now returned successfully and there is no Pod. This is normal. You created a Deployment, and a Deployment is a statement of intent that some other process has to act on.
Every controller in Kubernetes has the same four parts, and once you have seen them once you have seen all of them:
- an informer, holding a watch on the API server and a local cache of the objects it cares about;
- a workqueue, deduplicating and rate-limiting the things it has been woken about;
- a reconcile function, which compares desired state to observed state and makes one move toward closing the gap;
- a status write back to the API server, which is how anything else finds out what happened.
For your Deployment that runs twice. The deployment controller notices a Deployment with no matching ReplicaSet and creates one. The replicaset controller notices a ReplicaSet whose observed Pod count is below its desired count and creates Pods. Neither controller told the other anything; each was watching the database and saw a change.
kubectl get rs -l app=myapp                 # did a ReplicaSet appear at all
kubectl describe rs myapp-7d9f8             # its own events say why it cannot create Pods
kubectl get events --sort-by=.lastTimestamp -AA caution about that last one, because the corpus treats events as an authoritative log and they are not. Events are namespaced, they expire after an hour by default, and they are dropped under load. “There are no events” is not evidence of anything.
The most instructive stage 3 failure is the one where the Deployment is accepted and the Pod is not. Resource quota, a Pod Security Admission rule that the Deployment’s own schema does not violate but its pod template does, an admission webhook scoped to Pods — all of these produce a healthy Deployment, a ReplicaSet, and no Pod. The rejection happened in stage 2, but to a request nobody was watching, so it is recorded on the ReplicaSet as an event and nowhere else.
Operators and custom resources are this stage, not a different one. A CRD plus a controller is an informer, a workqueue, a reconcile loop and a status write — the same four parts. There is one pattern here, not two, which is why understanding the deployment controller is understanding every operator you will ever install.
Stage 4 — The scheduler
A Pod exists with no .spec.nodeName. The scheduler has a watch open, sees it, and runs two phases: filter, which eliminates nodes that cannot run the Pod, and score, which ranks the survivors. Then it does the only thing it ever does.
It writes one field. Binding is a write to the Pod’s pods/binding subresource that sets .spec.nodeName, and that is the scheduler’s entire output. It does not contact the node. It does not send the Pod anywhere. You can watch this happen with a diff:
# Before and after, on a Pod you have just created:
kubectl get pod myapp-xyz -o jsonpath='{.spec.nodeName}'; echo

# Why has it not been scheduled?  The scheduler's own reason:
kubectl get pod myapp-xyz -o jsonpath='{.status.conditions[?(@.type=="PodScheduled")]}' | jqTwo additions are recent enough that older writing does not have them. Scheduling gates (stable in v1.30) let something else hold a Pod out of scheduling entirely until a condition is met — a Pod with a gate is unschedulable on purpose and its PodScheduled reason says so. And Dynamic Resource Allocation reached stable in v1.34 and has dominated the two releases since; it is how devices such as GPUs are requested and allocated now, and it is no longer the experimental thing most pages still describe.
One historical note that explains a great deal of stale advice. The scheduler used to be configured with a policy file listing predicates and priorities. That mechanism was removed in v1.23, along with --policy-config-file and its companions; configuration is done with KubeSchedulerConfiguration profiles and plugins. The vocabulary survived anyway, partly because the upstream documentation still recommends the removed mechanism on its own concept page while linking to a reference page that says it has not been supported for fourteen releases.
Stage 5 — The kubelet
.spec.nodeName now names a machine, and the kubelet on that machine has a watch filtered to Pods bound to it. It sees the Pod and starts work — and this is where the article stops being about a distributed system and starts being about Linux.
The kubelet runs its own admission first, which is where a Pod that the scheduler thought would fit is refused by the node that was chosen for it. Then a pod worker takes it through mounting volumes, allocating any dynamic resources, and creating the sandbox — the shared namespaces and the network the containers will join.
The conditions, and the trap in reading them
| Condition | Written by | Means |
|---|---|---|
PodScheduled | the scheduler | bound to a node — stage 4 finished |
PodReadyToStartContainers | the kubelet | sandbox created, networking configured, volumes mounted, dynamic resources allocated |
Initialized | the kubelet | init containers complete — or there were none |
ContainersReady | the kubelet | every container has passed its readiness probe |
Ready | the kubelet | ContainersReady plus any custom readiness gates |
These conditions are not in chronological order, and this catches people. For a Pod with init containers, Initialized is set after the sandbox exists. For a Pod without init containers, Initialized is set to True before sandbox creation and network configuration have started.
So a completely ordinary broken Pod shows Initialized=True alongside PodReadyToStartContainers=False, and a reader treating the list as a sequence concludes that initialisation succeeded and the failure is later. It is earlier.
kubectl get pod myapp-xyz -o jsonpath='{range .status.conditions[*]}{.type}{"\t"}{.status}{"\n"}{end}'
kubectl describe pod myapp-xyz | sed -n '/Events:/,$p'The cgroup driver, which is now a three-body problem
Every page on the internet tells you to set cgroupDriver: systemd in the kubelet configuration. That advice is not wrong so much as no longer sufficient, and the reason is worth understanding because it is the subject of the worked diagnosis below.
The kubelet’s own default is cgroupfs, not systemd. systemd is recommended, and kubeadm sets it explicitly, but the upstream default never changed. And since v1.34 the kubelet usually does not use that setting at all: it asks the container runtime over a CRI call which driver to use, and the documentation states that it then ignores cgroupDriver in its own configuration. The fallback for runtimes too old to answer that call is announced for removal in v1.38.
Three regimes, then: the kubelet’s default, the kubelet’s configured value, and the runtime’s answer. Upstream documents all three and gives you no way to tell which one is live on your node. The runtime is the one to ask:
# On the node. This is the value that actually applies on v1.34 and later.
sudo crictl info | jq '.config.containerd.runtimes.runc.options.SystemdCgroup'

# And the cgroup version underneath it all — v2 if and only if this file exists.
stat -c '%n exists' /sys/fs/cgroup/cgroup.controllers 2>/dev/null \
|| echo 'cgroup v1 — a kubelet from v1.35 onward will refuse to start'That second command is a dated fact worth acting on before an upgrade rather than after. cgroup v1 went into maintenance mode in v1.31, and since v1.35 the kubelet’s failCgroupV1 setting defaults to true — the kubelet does not warn on a cgroup v1 node, it declines to start. There is still an override, and there is no committed date for removing the code, so do not print one.
Stage 6 — The CRI boundary
This is the shortest stage in the article because it is a boundary rather than a body of work — and unusually, the boundary has a name in the API.
When the sandbox exists, the network is configured, the volumes are mounted and any dynamic resources are allocated, the kubelet sets PodReadyToStartContainers to True. Upstream’s own wording for what follows is exact: image pulling and container creation occur after this point.
So when that condition goes True, you have left this article. Everything after it — the registry request, the manifest and the image digest, layers and the overlay mount, the OCI bundle, namespaces, the cgroup, seccomp and capabilities, and why your program ends up as PID 1 — is Containers, All the Way Down, and it is nine stages of its own.
Two things about the condition itself are worth printing. It was called PodHasNetwork in its alpha form and was renamed before beta, so a page using the old name is describing v1.28 or earlier. And it reached Stable in v1.37 — which means on an older cluster you may be looking at it as a beta feature, or not seeing it at all.
The other thing worth knowing here is what the runtime is. Since v1.26 Kubernetes speaks only v1 of the CRI API, and a runtime that does not implement it cannot register a node at all — dockershim was removed in v1.24, and the door it went through was subsequently bricked up. In practice the runtime is containerd or CRI-O, and on a node the tool is crictl, never docker.
sudo crictl ps                  # not docker ps
sudo crictl logs <container-id>
sudo crictl imagesStage 7 — Readiness, and the EndpointSlice controller
Containers are running. Nothing is sending them traffic yet, and the thing that decides is another controller with the same four parts as stage 3 — which is the point of ending here rather than in the dataplane.
The kubelet runs each container’s readiness probe and writes the result into .status. The EndpointSlice controller has a watch on Pods and on Services; when a Pod matching a Service’s selector becomes ready, it adds that Pod’s address to an EndpointSlice. Nobody told it. It noticed.
kubectl get endpointslices -l kubernetes.io/service-name=myapp
kubectl get endpointslices -l kubernetes.io/service-name=myapp -o yaml | grep -A2 conditionsAn empty EndpointSlice for a Service whose Pods are running is the quickest way to tell that readiness is failing rather than startup. And the resource name matters: v1.Endpoints was deprecated in v1.33, and although the old controller still runs and still creates Endpoints objects, nothing in the control plane reads them any more. New Service features — dual-stack, traffic distribution — are EndpointSlice-only. A page that says a Service creates an Endpoints object is describing a mechanism that has been vestigial for four releases.
What kube-proxy then does with that EndpointSlice is a different article. If you are looking for it because traffic is not arriving, the one thing to check first is which mode you are in, because the advice you find will assume the wrong one:
kubectl -n kube-system get configmap kube-proxy -o jsonpath='{.data.config\.conf}' | grep 'mode:'Advice that has expired
Kubernetes moves three times a year, and the writing about it does not. The rows below are ordered roughly by what happens to someone who acts on them.
| What you will still read | What is true now |
|---|---|
| “Use ingress-nginx, it is the standard ingress controller” | Retired in March 2026. No releases, no bugfixes and no security fixes; the repository moved to kubernetes-retired. Gateway API reached v1.5 in February 2026 and ingress2gateway exists to migrate |
“Set cgroupDriver: systemd in the kubelet config and you are done” | Since v1.34 the kubelet asks the runtime and ignores its own setting. Ask crictl info, not the config file. The fallback for old runtimes goes in v1.38 |
| “cgroup v1 still works, it is just old” | Since v1.35 failCgroupV1 defaults to true and the kubelet refuses to start. An upgrade takes the node down |
| “containerd 1.6 or 1.7 is fine” | Kubernetes 1.36 wants containerd 2.2.0+ or 2.3.0+; the 1.7 line is not in the matrix and its extended support ends this month |
containerd config under [plugins."io.containerd.grpc.v1.cri"] | containerd 2.x reads [plugins.'io.containerd.cri.v1.runtime'] with version = 3. The old stanza is silently inert and settings in it revert to defaults |
| “The API server validates the manifest, then runs admission, then saves it” | authn → authz → mutating admission → validation → validating admission → the etcd write. Validation is between the admission phases |
| “A Service creates an Endpoints object” | v1.Endpoints deprecated in v1.33. The EndpointSlice controller is the one that matters; nothing in the control plane reads Endpoints |
| “IPVS mode is the scalable choice over iptables” | IPVS is deprecated as of v1.37 and warns on startup, off by default by v1.40 and removed by v1.43. The successor is nftables, stable in v1.33. The default is still iptables |
“In big clusters, raise kube-proxy’s minSyncPeriod“ | Since v1.28 iptables mode syncs only what changed. The override is now counterproductive and upstream says to remove it |
PodSecurityPolicy, or policy/v1beta1 | PSP removed in v1.25. Pod Security Admission is stable and PodSecurity is on by default — as is ValidatingAdmissionPolicy, which does CEL admission with no webhook at all |
| “Configure the scheduler with predicates and priorities, or a policy config file” | Scheduler policy was removed in v1.23. Use KubeSchedulerConfiguration profiles. Upstream’s own concept page still recommends the removed mechanism |
| “DRA is a new alpha thing for GPUs” | Stable since v1.34, and the dominant theme of the two releases after it |
| “Sidecars are a pattern, not a feature” | Native sidecars — restartPolicy: Always on an init container — stable in v1.33. They start before the main containers and keep restarting even in a Pod whose own restartPolicy is Never |
“The condition is called PodHasNetwork“ | Renamed PodReadyToStartContainers before beta, and Stable in v1.37 |
| “kube-dns is the cluster DNS” | CoreDNS has been the default since v1.13; kube-dns was deprecated in v1.37 |
Images from k8s.gcr.io | Frozen in April 2023. registry.k8s.io is canonical |
| “Dockershim was removed but you can still use Docker with a shim” | Since v1.26 Kubernetes speaks only CRI v1, and a runtime that does not implement it cannot register a node |
docker ps / docker logs on a node | crictl ps / crictl logs |
“kubectl apply --prune is how you clean up” | ApplySet-based prune has been alpha since v1.27 with no beta date. The old --prune is not something to build on |
| “In-tree volume plugins and cloud providers” | CSI migration stable in v1.25; in-tree cloud providers fully removed in v1.31 |
| “Static pods can reference a Secret or ConfigMap” | Prohibited as of v1.37, and the opt-out gate is gone |
| “cAdvisor is where pod metrics come from” | Moving to the CRI — PodAndContainerStatsFromCRI went beta in v1.37, off by default. Separately, metrics.k8s.io finally reached v1 after about nine years in beta |
The direction of the error, and a test you can apply in ten seconds
Something unusual is true of the stale writing on this subject: most of it is not wrong on facts. It says containerd rather than Docker. It mentions the CRI. It has heard that PodSecurityPolicy is gone. A keyword scan comes back cleaner here than it does for most subjects.
It is wrong in one direction, and everything else follows from it. It describes Kubernetes as a pipeline in which each component hands work to the next. Kubernetes is not a pipeline. It is a set of independent processes watching one database.
Three symptoms fall out of that single error. Admission control goes missing, because in a pipeline model it has nowhere to live — it is not a component, it is a phase inside one. No step has a failure mode, because in a pipeline the only possible failure is a handoff that did not happen, and there are no handoffs. And the article cannot tell you where to look, only what order things happen in — which is the entire difference between such a page and this one.
Which gives the test. On the path from kubectl apply to a running container there are exactly two synchronous calls: kubectl to the API server, and the kubelet to the runtime. If a page tells you the API server notifies the scheduler, or the scheduler sends the Pod to a node, or the control plane instructs the kubelet, it is describing a system that does not exist. Grep for the verbs — notifies, informs, instructs, sends to, hands off, triggers — used between two control-plane components.
Two honest exceptions, so the test stays exactly true. Admission webhooks are a synchronous outbound call from the API server, but they are a branch off the first call rather than a step along the path. And the API server calls kubelets directly for logs, exec and port-forward — which is the debugging path, not the apply path.
If you prefer a keyword scan as well, the tokens that still look current are the useful ones: io.containerd.grpc.v1.cri, mode: ipvs, minSyncPeriod, kube-dns, ingress-nginx without a retirement warning, PodHasNetwork, docker ps on a node, and cgroupDriver: systemd presented as sufficient. Three hits and the page predates your cluster.
A worked diagnosis
A self-managed cluster is upgraded from v1.33 to v1.36. Because v1.36 requires a newer containerd, the same maintenance window also takes containerd from 1.7 to 2.3. Everything comes back up. Pods start.
Over the following days one node behaves badly under load. Containers are killed without an out-of-memory event in their own memory cgroup. kubectl describe node shows repeated SystemOOM. The node goes NotReady intermittently and recovers on its own. And every configuration file anyone opens says the right thing.
$ grep cgroupDriver /var/lib/kubelet/config.yaml
cgroupDriver: systemdWalk the spine. Stage 1 is clean; the manifests applied. Stage 2 is clean; the Pod objects are exactly right. Stage 3 is clean; the ReplicaSet made them. Stage 4 is clean; .spec.nodeName is set. Stage 5 — the kubelet accepted the Pod, .status is populated, and PodReadyToStartContainers goes True. By the hinge, the reader is past the boundary and into the containers article.
Which is the useful part of this example rather than a flaw in it. The hinge is a localiser, not an oracle. It correctly says the symptom appears past stage 6. The cause is a negotiation inside stage 5, and the way to find it is to ask the runtime instead of the file:
$ sudo crictl info | jq '.config.containerd.runtimes.runc.options.SystemdCgroup'
false

$ containerd config dump | head -1
version = 3There it is. The containerd configuration on this node still carries a stanza written in 2021:
[plugins."io.containerd.grpc.v1.cri".containerd.runtimes.runc.options]
SystemdCgroup = truecontainerd 2.x does not read that path. It reads [plugins.'io.containerd.cri.v1.runtime'...]. The old stanza is not rejected and does not warn — it is simply not the setting any more, so SystemdCgroup is at its default of false.
And since v1.34, the kubelet does not use its own cgroupDriver. It asks containerd, containerd says cgroupfs, and the kubelet follows it there. Now two cgroup managers are writing the same hierarchy on a systemd host: systemd periodically reaps cgroups that containerd created, and the symptoms are exactly the ones above.
The repair is containerd config migrate — and then replacing the node. Changing a live node’s cgroup driver is documented as unsafe: the kubelet cannot re-create sandboxes for the pods already running there, and restarting it does not help. Cordon, drain, rebuild.
The moral is small and travels a long way past Kubernetes. A configuration file that is still parsed is not a configuration file that is still obeyed. It happened twice in one incident here — containerd reading a file that no longer contains its settings, and the kubelet reading a setting it no longer consults — and it is the shape of every superseded .d directory and every daemon that keeps reading an old file for compatibility and then quietly overrides it.
Before you call it done
None of the above is worth much until you know what your own cluster is. Every one of these answers a question this article raised, and none of them can be answered from a table in an article, because the differences are set when the cluster is installed.
# Which Kubernetes, client and server
kubectl version

# Per node: kubelet version, runtime and version, kernel, OS.
# Answers "containerd 1.x or 2.x" and "which kernel" in one command.
kubectl get nodes -o custom-columns=\
'NODE:.metadata.name,KUBELET:.status.nodeInfo.kubeletVersion,'\
'RUNTIME:.status.nodeInfo.containerRuntimeVersion,'\
'KERNEL:.status.nodeInfo.kernelVersion,OS:.status.nodeInfo.osImage'

# Is the control plane healthy, component by component
kubectl get --raw='/readyz?verbose'

# Which kube-proxy mode
kubectl -n kube-system get configmap kube-proxy -o jsonpath='{.data.config\.conf}' | grep 'mode:'

# On a node: cgroup version, and the runtime's own view of the driver
stat -c '%n exists' /sys/fs/cgroup/cgroup.controllers 2>/dev/null || echo 'cgroup v1'
sudo crictl info | jq '.config.containerd.runtimes.runc.options.SystemdCgroup'A note on where you got your cluster, because it changes what you will see. kubeadm ships no CNI at all — nodes stay NotReady and CoreDNS stays Pending until you install one, which is the single most common “my new cluster is broken” report and is not a fault. k3s bundles everything into one binary and defaults to SQLite behind an etcd-API shim rather than etcd itself, with its own CNI, load balancer and ingress installed by default; a k3s reader will not recognise stages 2 to 4 as separate processes, because for them they are not. kind runs nodes as containers and uses kubeadm underneath. On EKS, GKE and AKS the whole control plane is invisible, and .status.conditions is your only instrument for the first half of the path.
What to hold on to
Two synchronous calls and one database. kubectl calls the API server; the kubelet calls the runtime. Everything else is a process writing a field and another process noticing. Once that is the frame, the questions change from “what happens next” to “who was supposed to write this, and did they”.
Ask who owns the field. .spec is yours, .spec.nodeName is the scheduler’s, .status on a Pod is the kubelet’s. That one rule localises a failure to a stage faster than any log, and it works identically on a cluster whose control plane you cannot see.
Read conditions as ownership, not as a timeline. They are written by different processes at different moments and they are not in order.
And ask the running system, not the file. The worked diagnosis above is one instance of a general rule, and it is the one that survives every version bump: a configuration file that is still parsed is not a configuration file that is still obeyed.
Related reading
- Containerising a Service — the guide this page sits underneath
- Containers, All the Way Down — everything after
PodReadyToStartContainers, in nine stages - Containers — namespaces, cgroups and overlay filesystems, if stage 5 assumed too much
- DNS, All the Way Down — where the
ndotssetting inside a Pod comes from, and what it costs - The Life of a Package — the other article whose subject is a configuration file that stopped meaning what it says
- Running PostgreSQL Properly — the other long Guides piece, and the one to read before running a database in any of this